
COVID-19 Update January 29
- Total: 2,040 confirmed cases in Salem.
- Salem’s Positivity Rate for the past 2 weeks: 8.2%
- 1 out of every 15 Salem residents have been infected
- Salem today: 21 new cases; 165 active cases.
• • • • • • Report from NH Department of Health and Human Services (NH DHHS) • • • • • •
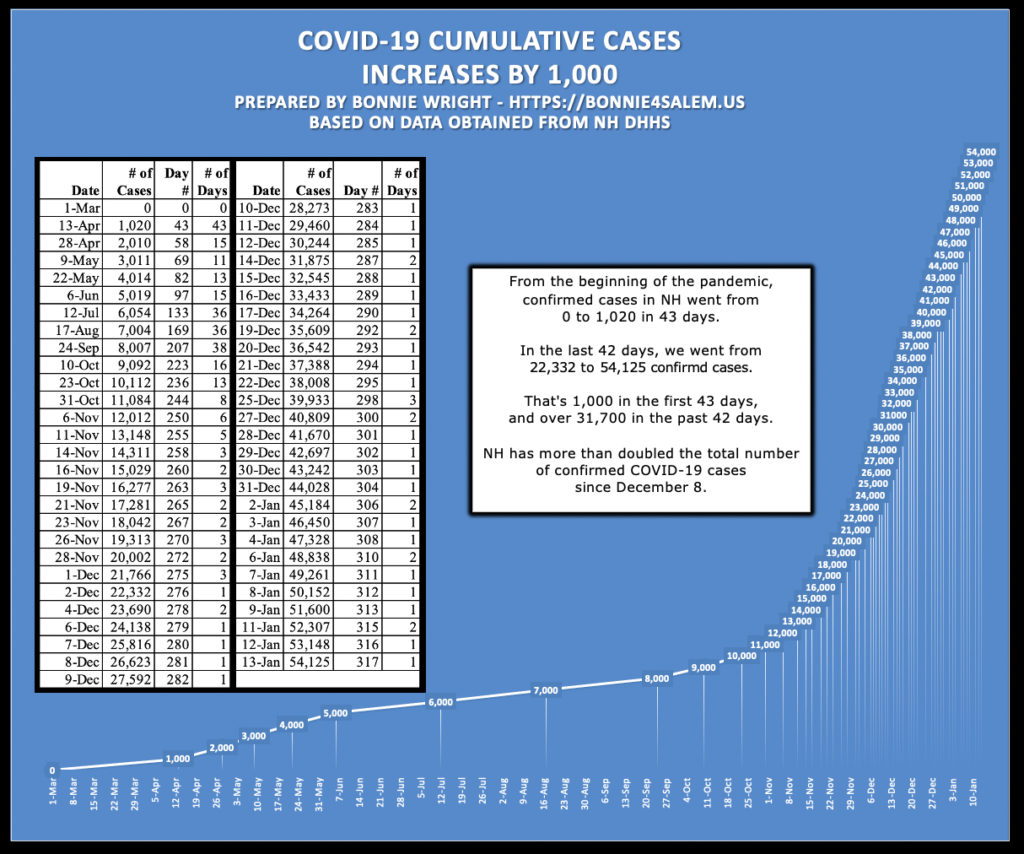
On Friday, January 29, 2021, DHHS announced 614 new positive test results for COVID-19, for a current PCR test positivity rate of 3.4%. There are now 5,388 current COVID-19 cases diagnosed in New Hampshire. Of the results reported today:
- 1/27: 198 new cases today, for an updated total of 713 cases
- 1/28: 416 new cases
Test results for previous days are still being processed and the total number of new positives for those days are not yet complete. Updated case counts for prior days will be reflected on the COVID-19 interactive dashboard.
• • • • • • TODAY’S SPOTLIGHT • • • • • •
- Salem has 21 new cases today. Our average over the past week is 18.6 cases per day, and over the past two weeks is 19.9 cases.
- DHHS reported 614 new cases today. The difference between yesterday’s total cases and today’s cases is 580. Why don’t these numbers match? I talk about this a little more in my message, below.
- Active cases today are 5,388, only 14 more than yesterday.
- Recovered cases today are 552, holding steady at 90% of all confirmed cases.
- Since the last update, 8 more people were admitted to the hospital for the first time, including three people from Rockingham County.
- There are now 214 people who are currently hospitalized in NH with COVID-19. The average over the past week is 224 people per day.
- Two more people were admitted to the ICU in the 24-hour period covered by this update.
- Another 14 people died in NH from COVID since the last report, bringing NH’s total to 1,036. 65 people have died in the past week, with 42 lives lost in the past three days.
- National news says that January is the deadliest month for our country. 26.7% of all deaths in NH – more than a quarter – have taken place this month, and we still have a few days left to the month.
• • • • • • Communities • • • • • •
- NH DHHS reports that the new cases reside in Rockingham (126), Hillsborough County other than Manchester and Nashua (117), Merrimack (52), Strafford (42), Sullivan (31), Belknap (26), Cheshire (23), Grafton (22), Carroll (20), and Coos (7) counties, and in the cities of Manchester (68) and Nashua (54). The county of residence is being determined for twenty-six new cases.
• • • • • • Community Transmission • • • • • •
Per NH Department of Health and Human Services: The overall level of community transmission is defined using three metrics. A community is then assigned an overall level based on the highest-level determination for any specific metric. NH Metrics are:
- New Cases per 100k over 14 days: Scale: Minimal: <50; Moderate: 50 – 100; Substantial: >100.
- New Hospitalizations per 100k over 14 days: Scale: Minimal: <10; Moderate: 10 – 20; Substantial: >20.
- Average PCR Test Positivity Rate over 7 days: Scale: Minimal: <5%; Moderate: 5% – 10; Substantial: >10%
- Average of New Cases per 100K people over 14 days:
- New Hampshire: 551.3 (2 weeks ago: 667.2)
- Rockingham County: 600.6 (2 weeks ago: 662.1)
- Salem: 801.0 (2 weeks ago: 804.0)
- New Hospitalizations per 100K over 14 days:
- New Hampshire: 2.0 (2 weeks ago: 1.4)
- Maximum of 10 counties + 2 biggest cities is Strafford: 3.3 (2 weeks ago: 1.1) (2 weeks ago: Manchester was highest at 3.7; now 2.0)
- Average Positivity Rate (PCR + Antigen) over 7 days:
- New Hampshire: 5.4% (2 weeks ago: 7.2%)
- Rockingham County: 7.5% (2 weeks ago: 8.3%)
- Salem: 8.2% (2 weeks ago: 9.0%)
- Manchester: 7.1% (2 weeks ago: 8.1%
- Nashua: 9.6% (2 weeks ago: 10.1%
- 47 communities have a positivity rate higher than Salem. (was 51 two weeks ago)
- 30 communities have a positivity rate of more than 10%. (was 36)
- 91 communities have a positivity rate of more than 5%. (was 120)
- 124 communities have a positivity rate of more than 2%. (was 139)
• • • • • • DIAGNOSTIC TESTS IN NH • • • • • •
- New positive cases by my math (Total of today’s cases minus previous total): 580
- New positive cases per DHHS: 614
- 364 PCR tests
- 216 Antigen tests
- PCR percentage: 62.8%
- Children under 18 in new cases: 87
- % of new cases announced by DHHS today that are kids under 18 years old: 14.2%
- Total positive cases in NH: 64,838
- Percentage of today’s tests that are positive per DHHS: 3.4%
- Total PCR test results reported today (Positive results plus negative results): 2,560
- New negative results reported today: 1,980
- Total negative cases in NH: 530,243
• • • • • • ROCKINGHAM COUNTY • • • • • •
- Total cases in Rockingham County: 15,794
- New cases in Rockingham County: 126
- Rockingham County Positivity Rate: 7.5%
- Percent of NH cases that are from Rockingham County: 24.4%
• • • • • • CHANGES BY AGES • • • • • •
(Shown: Total infections, percentage of all infections, and increase yesterday.)
- 0-9: 2936 = 5% (+35).
- 10-19: 6687 = 10% (+66).
- 20-29: 12195 = 19% (+115).
- 30-39: 9500 = 15% (+89).
- 40-49: 8725 = 13% (+77).
- 50-59: 10424 = 16% (+87).
- 60-69: 7017 = 11% (+61).
- 70-79: 3772 = 6% (+27).
- 80+: 3492 = 5% (+22).
- Unknown: 90 = 0% (+1).
• • • • • • ACTIVE CASES • • • • • •
- Active cases in NH: 5,388
- Active cases in Rockingham County: 1,242
- Percent of NH’s active cases that are in Rockingham County: 23.1%
• • • • • • RECOVERED IN NH • • • • • •
- Announced today: 552
- Total Recovered: 58,414
- Percentage of diagnosed cases that have recovered: 90.1%
• • • • • • HOSPITALIZATIONS IN NH • • • • • •
- Currently hospitalized: 214
- New people hospitalized from NH: 8
- Total hospitalized patients: 1,029
- Percentage of those who have been infected that have been hospitalized: 1.59%
- Total admitted to ICU: 329
- New hospitalized patients from Rockingham County: 3
- Total hospitalized patients from Rockingham County: 238
• • • • • • DEATHS IN NH • • • • • •
- Lives lost today: 14
- Persons over 60 years of age who died today: 14
- Persons under 60 years of age who died today: 0
- Total fatalities in NH associated with COVID-19: 1,036
- NH Residents diagnosed with COVID-19 that died: 1.60%
- Lives lost in Rockingham County today: 2
- Total lives lost in Rockingham County: 179
These are not simply numbers. We must not forget that these are all someone’s husband or wife, mother or father, sister or brother, son or daughter, friend or neighbor.
Hello, Salem!
DHHS has been reporting the number of new PCR vs Antigen test results in their Press Release. Today they dropped that information. I could be “conspiracy thinking,” but this feels like an attempt at less transparency. Attempt, but we can, however, still compute it from the Summary Dashboard.
In the process of reworking my formulas, I realized something interesting: When I subtract yesterday’s PCR test results from today’s PCR test results, I get the count of the new PCR tests. Ditto for the antigen tests. When I add them together, I come up with what I would expect to be the count of today’s new cases. I don’t.
What I DO come up with is what is reported above as “New positive cases by my math.”
Isn’t that interesting!?! Why is that number different from what NH DHHS reports each day? Today the difference between cases reported by DHHS and new cases by math is 34 cases. That’s 34 people who are counted … oddly? … incorrectly? … unexplainably? Occasionally it’s dead-on, with no discrepancy, but that’s rare, and there have been times when there has been a 100-case difference.
There may be a reasonable explanation, but I fail to see it.
I question the number of new cases per day that are announced, now more than ever. (I do find it far easier to accept the accuracy of the total number of confirmed positive cases.)
It’s another weekend. If the national news predictions are accurate, it is about to get more dangerous out there. Please, in a world full of controversy, be smart, stay safe, and always, be kind.
~Bonnie


The following video was posted almost two months ago. Things have changed in that time. On October 2, US deaths were 1,035,451, according to the video. (My records say 1,033,174 per WorldOmeter.) WorldOMeter now says the global death rate is 1,446,889, an increase of 413,715 in less than two months. Just please remember that there is a lot more between COVID->Death vs. COVID->Recovery. More and more, long-haulers are making the news, as are other consequences of COVID-19.


This screenshot comes from https://www.cdc.gov/mmwr/volumes/69/wr/mm6942e2.htm?s_cid=mm6942e2_w
This report is explained here:
https://www.clickondetroit.com/health/2020/10/20/cdc-from-january-to-october-us-had-299k-more-deaths-than-in-previous-years/
Useful links
- Salem Resource Center of Southern NH Services: Housing relief and fuel assistance. 603-893-9172. https://www.snhs.org
- Legal issues because of COVID: https://nhlegalaid.org/legal-issues-during-covid-19-crisis.
- Food pantries: https://www.foodpantries.org/ci/nh-salem and http://www.wecarecharity.org/projects
- Unemployment resources: https://www.bonnie4salem.us/unemployed/
- COVID-19 testing: https://www.bonnie4salem.us/covid-19-testing/
- Complications of COVID-19: https://www.bonnie4salem.us/covid-19-consequences/
- COVID-19 is not the flu. Here are the numbers: https://www.bonnie4salem.us/covid-pneumonia-flu/
- The Science Behind Masks: https://www.bonnie4salem.us/science-behind-masks/
- Resources for Salem residents: https://www.bonnie4salem.us/covid-19-cases-in-salem/
- Safer at Home guidance documents on the State’s website.
- Other COVID resources from NH DHHS on the State’s website.
- Other COVID resources: https://www.bonnie4salem.us/covid-19-resources/
- Massachusetts Travel Order: https://www.bonnie4salem.us/massachusetts-travel-order/
- Mental health resources
- NAMI, the National Alliance on Mental Health. 24-hour hotline: 1-800-950-6264. https://www.nami.org/Home
- Center for Life Management (603) 434-1577, Option 1. https://www.centerforlifemanagement.org/
- #SuicideAwareness: 1-800-273-8255.
- Vaccines:
- Phase 1A is in effect now.
- Phase 1B is scheduled to begin on January 26.
- Those 65 or older can register beginning January 22 at www.vaccines.nh.gov. Those without internet can call 211.
- Those who have severe medical conditions (or care for a child with severe medical conditions) should contact their doctor.
- Others who qualify because of their employment will be notified by employers.
- Future Phases will be updated as more info becomes available. Phase 1B will take a long time.
Sources used to create these reports: